The number that looks like progress
A director I worked with once cut median cycle time from 4.1 days to 1.8 days in a quarter. The dashboard was gorgeous. Leadership was thrilled. Then a Staff engineer pulled me aside and said the quiet part: "We're just splitting PRs into pieces so small they don't do anything. The work takes exactly as long. It's spread across five PRs now instead of one."
That's cycle time in a nutshell. It's one of the most useful signals in the DORA metrics family — and one of the easiest to turn into theater. So let's take it apart. How to measure it, what it genuinely tells you, and the specific ways teams fool themselves with it.
A quick note before we go: cycle time is not technically one of the four DORA metrics (deploy frequency, lead time for changes, change failure rate, time to restore). But lead time for changes and cycle time get used interchangeably in practice, and most "DORA dashboards" ship a cycle time chart. So I'm treating it as the DORA-adjacent metric it's become. If you want the strict definition of the four, DORA's lead time for changes is "time from commit to running in production." Cycle time usually means something narrower.
What cycle time actually measures
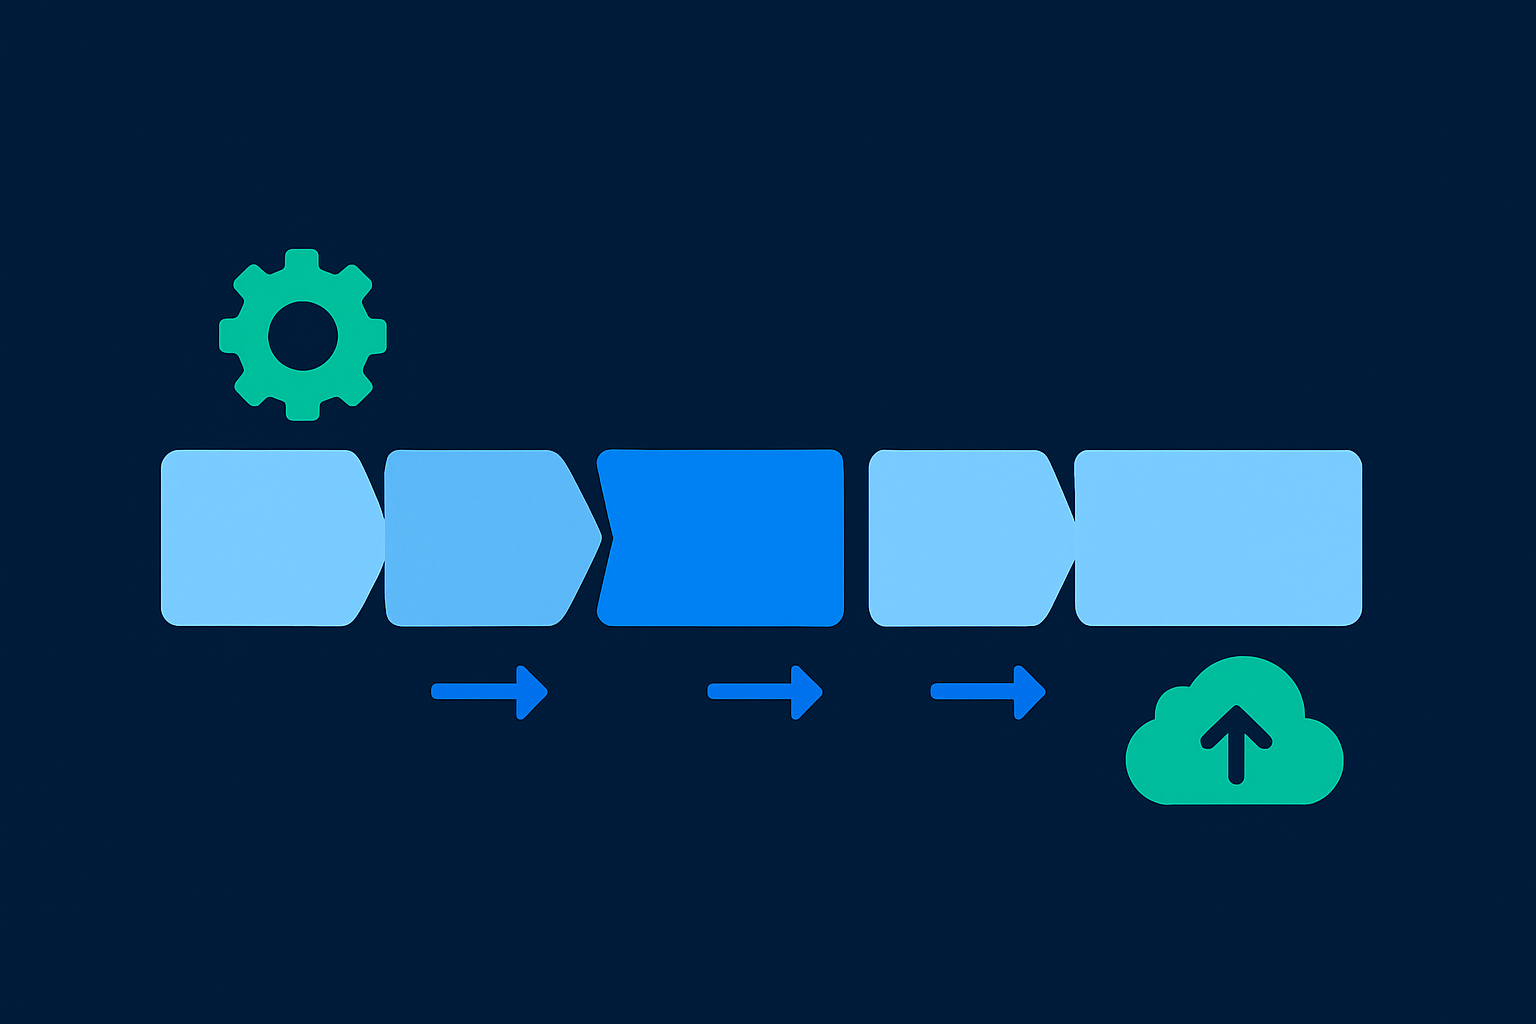
Cycle time is the elapsed time across the stages a change moves through before it ships. The stages people usually track:
- Coding time — first commit to PR opened
- Pickup time — PR opened to first review
- Review time — first review to approval
- Deploy time — merge to production
Add those up and you get cycle time. The value isn't the total — it's the breakdown. A 3-day cycle time made of 2.5 days of pickup time tells a completely different story than 3 days spread evenly. The first is a review-bandwidth problem. The second might be that your changes are just big.
Here's the trap in the raw definition: "first commit" is a lie. Engineers branch, commit, walk away for two days, come back. Your coding-time metric now includes a lunch break and a fire drill on another project. If you're computing this yourself, anchor stages to events you can trust — PR opened, review requested, approved, merged, deployed — and be suspicious of anything derived from local commit timestamps.
# Rough cycle-time stages from GitHub PR + deploy data
from datetime import datetime

def parse(ts):
    return datetime.fromisoformat(ts.replace("Z", "+00:00"))

def stages(pr, deploy_time):
    opened = parse(pr["created_at"])
    first_review = parse(pr["first_review_at"])
    approved = parse(pr["approved_at"])
    merged = parse(pr["merged_at"])
    deployed = parse(deploy_time)
    return {
        "pickup_hrs": (first_review - opened).total_seconds() / 3600,
        "review_hrs": (approved - first_review).total_seconds() / 3600,
        "deploy_hrs": (deployed - merged).total_seconds() / 3600,
    }
Notice I dropped coding time. If you can't measure it honestly, don't put it on a dashboard leadership will act on. A metric you can't trust is worse than no metric — it's confident and wrong.
Use the median, then look at the tail
Mean cycle time is useless. One PR that sat open for three weeks over the holidays will drag your average into fiction. Use the median (p50) for the headline, and always show p75 or p90 next to it.
The tail is where the story lives. A team with a 1-day median and a 12-day p90 has a bimodal problem: most work flies through, but a specific class of change gets stuck. Usually that's cross-team dependencies, migrations, or the one reviewer everyone's waiting on. Averaging that away hides the exact thing you'd want to fix.
Team A:  p50 = 1.2d   p90 = 2.1d    -> healthy, predictable
Team B:  p50 = 1.1d   p90 = 11.4d   -> something is stuck in the tail
Same median. Wildly different reality. If your tool only shows you the median, you're flying half-blind.
What cycle time does not tell you
This is where most leaders get burned. Cycle time measures flow, not value and not quality.
It says nothing about whether the change was worth making. A team can ship garbage fast and post beautiful numbers. It says nothing about whether the change was correct — that's what change failure rate is for, and that metric lies to you the moment your tests are flaky. And it says nothing about how much real work is in a PR, which is exactly the loophole the PR-splitting team drove a truck through.
Cycle time is a rate metric. Pair it with a quality metric or you'll optimize yourself into a corner. Fast and broken is not a win. The whole point of DORA's research was that elite teams are fast and stable — the two move together when the system is healthy, and diverge when someone's gaming one at the expense of the other.
It also can't distinguish a fast pipeline from a skipped one. If cycle time drops because someone quietly removed a required check or started merging on red, your dashboard reports an improvement. That's not faster delivery. That's a weaker gate — and in a SOC2 or ISO 27001 shop, a weaker gate is an audit finding waiting to happen. Keep the deploy pipeline honest; auditors care about the evidence trail, not the vanity chart.
The four ways teams game cycle time
1. PR salami-slicing. The classic. Break one feature into eight trivial PRs. Each one flies through review because there's nothing to review. Total human effort unchanged, total value unchanged, cycle time looks incredible. The tell: PR count spikes while feature throughput stays flat.
2. Rubber-stamp reviews. When review time is the metric under pressure, reviews get faster by getting worse. "LGTM" 90 seconds after a 600-line diff isn't review — it's compliance theater. Watch review time and change failure rate together. If review time drops and failure rate climbs, you found your gamed metric.
3. Merging on red. Cycle time counts merge-to-deploy, so anything that lets code merge sooner "improves" it. The ugliest version: a flaky suite trains people to merge through failures. Flaky tests don't just cost time — they corrupt every downstream metric you compute from CI outcomes. If your suite fails 5% of the time for no reason, the real cost is far more than the reruns, and cycle time is one of the casualties.
4. Starting the clock late. If "cycle" begins at PR-open, teams learn to do most of the work before opening the PR, then open it fully baked. Nothing wrong with polished PRs — but your metric now reports a fantasy where the work took two hours instead of two days.
None of these are malice. They're rational responses to a metric with a bonus attached. Goodhart's law does the rest: the moment a measure becomes a target, it stops being a good measure.
How to use it well
Measure cycle time to find bottlenecks, not to rank humans. The instant an engineer's individual cycle time shows up in a performance review, every gaming behavior above becomes their survival strategy. Use it at the team and system level.
Segment before you conclude. Bug fixes, features, and dependency bumps have different natural cycle times. Blending them produces a number that describes nothing. Split by change type and the bottlenecks get obvious.
Watch the stage breakdown, not the total. If pickup time is your biggest bucket, the fix is a review-assignment policy or a smaller reviewer pool per team — not "everyone code faster." If deploy time dominates, your problem is pipeline speed, and that's a place where flaky tests and slow CI are usually hiding. Getting CI fast and trustworthy does more for cycle time than any process memo.
And hold cycle time next to a quality metric always. Fast delivery with a rising change failure rate isn't improvement — it's a leak with a nicer dashboard. If you want the companion metric done right, start with the git metrics that actually tell you something and build up from there.
The one question the number should answer
When someone asks "are we shipping faster?", cycle time answers a narrower question honestly: "how long does a change spend in each stage of our pipeline?" That's it. It's a flow diagnostic, not a productivity score.
Treat it like a thermometer. It tells you where the heat is. It doesn't tell you the patient is healthy, and it definitely doesn't tell you which nurse to fire. The teams that get value from DORA metrics use them to find and remove friction — slow reviews, big batches, flaky pipelines. The teams that get burned turn them into targets and then act surprised when the numbers improve while the actual work doesn't.
Measure the stages. Trust the tail more than the median. Pair it with quality. And keep your CI signal clean, because every one of these metrics is computed from CI outcomes — and a lying signal produces a lying dashboard.