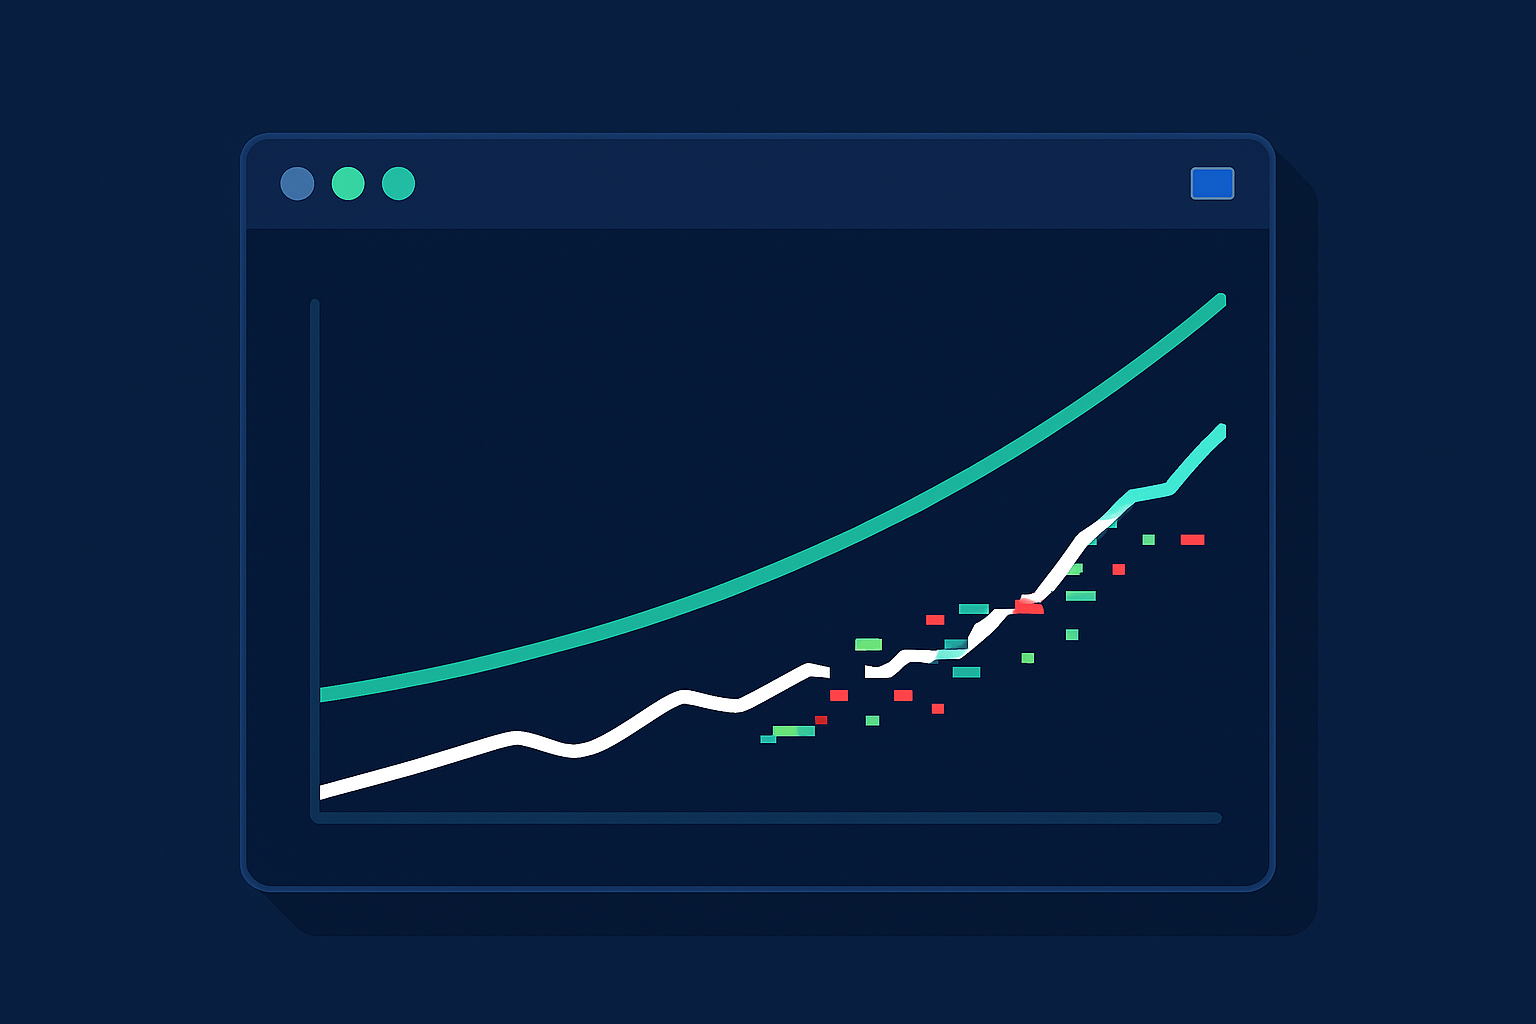
The dashboard that lied
A platform team I worked with once doubled their deploy frequency in a single quarter. The VP was thrilled. The chart went up and to the right, the board deck got a new slide, and everyone moved on.
Here's what actually happened: they split one monolith deploy pipeline into four service pipelines. Same code, same release cadence, same amount of value reaching customers. Four times the "deploys." Nobody was lying, exactly. The metric just answered a different question than the one leadership thought they were asking.
Deploy frequency is my favorite DORA metric and also the one I see misused most often. It's the easiest to game, the easiest to misread, and, when you measure it honestly, one of the most revealing numbers about how your engineering organization actually works. So let's take it apart: how to measure it, what it tells you, what it absolutely does not tell you, and the specific failure modes I keep seeing in orgs between 100 and 800 engineers.
What deploy frequency actually measures
The DORA research defines deploy frequency as how often your organization deploys code to production or releases it to end users. Elite performers deploy on demand, multiple times per day. Low performers deploy somewhere between once a month and once every six months.
But the raw count is not the point. Deploy frequency is a proxy for batch size. If you deploy twice a year, each deploy carries six months of changes. If you deploy twenty times a day, each deploy carries one small change. That difference cascades into everything:
- Small batches are easier to review, easier to test, and dramatically easier to roll back.
- When a small deploy breaks, the diff is short and the culprit is obvious. When a six-month deploy breaks, you're running a murder mystery with forty suspects.
- Frequent deploys mean your pipeline gets exercised constantly, so it stays healthy. Rare deploys mean every release is a special event with a runbook and a war room.
So when I look at a deploy frequency number, I'm not asking "how productive is this team?" I'm asking "how expensive is it for this team to ship one change?" A team that deploys daily has driven the marginal cost of a deploy close to zero. A team that deploys monthly is telling you, whether they know it or not, that each deploy is scary and expensive. That fear has a root cause, and finding it is where the metric earns its keep.
How to measure it without fooling yourself
The number one rule: count production deploys that could reach users, and count them per deployable unit, not per organization.
That means you need a precise definition of "deploy" before you write a single query. I recommend: a successful completion of the pipeline stage that ships artifacts to the production environment. Not staging. Not a canary that serves zero traffic. Not merges to main (that's a different metric, and conflating the two is how teams with broken release processes end up with beautiful dashboards).
If you're on GitHub Actions, the cleanest source of truth is the Deployments API. Have your production deploy job record a deployment so you have a durable, queryable event log instead of scraping workflow runs later:
# .github/workflows/deploy.yml
deploy-production:
  runs-on: ubuntu-latest
  environment: production
  steps:
    - uses: actions/checkout@v4
    - name: Ship it
      run: ./scripts/deploy.sh production
    - name: Record deployment
      uses: actions/github-script@v7
      with:
        script: |
          await github.rest.repos.createDeployment({
            owner: context.repo.owner,
            repo: context.repo.repo,
            ref: context.sha,
            environment: 'production',
            auto_merge: false,
            required_contexts: []
          });
Then compute frequency per service, per week, and look at the distribution rather than the average:
SELECT
  service,
  date_trunc('week', deployed_at) AS week,
  count(*) AS deploys
FROM deployments
WHERE environment = 'production'
  AND status = 'success'
GROUP BY service, week
ORDER BY service, week;
Two details that matter more than they look:
Use the median across services, not the sum. The org-wide sum is the number that quadrupled in my opening story. If you have 40 services and one of them deploys hourly while 39 deploy quarterly, the sum looks fantastic and the reality is grim. The per-service median tells you what shipping feels like for a typical team.
Count successful deploys only, but track failed ones separately. A pipeline that attempts ten deploys and lands three is not a high-frequency pipeline. It's a slot machine. That failure ratio is its own signal, and it usually points at the same place: the test suite.
What it tells you, and what it doesn't
Measured honestly, deploy frequency tells you three things:
- Your batch size, and therefore your blast radius per change.
- Your team's trust in the pipeline. Nobody deploys ten times a day through a pipeline they don't believe.
- The transaction cost of shipping. High frequency means low ceremony. Low frequency means somewhere in your process there's a toll booth: a manual QA gate, a change advisory board, a flaky test suite everyone reruns three times.
Here's what it does not tell you, and this is the list to laminate and hand to anyone who wants to put deploy frequency in a performance review:
- It doesn't measure value. Twenty deploys of feature-flag plumbing and config tweaks can be worth less than one deploy of the thing your biggest customer asked for. Deploy frequency measures the health of your delivery pipe, not what flows through it.
- It doesn't measure individual or team productivity. A team maintaining a stable internal service should deploy less than a team iterating on a new product. Comparing their numbers is comparing a fire truck to a taxi by miles driven.
- It doesn't measure quality on its own. You can deploy constantly and break production constantly. That's why DORA pairs it with change failure rate and time to restore. Deploy frequency without its stabilizing partners is a vanity metric wearing a lab coat.
- It's not cycle time. Cycle time (first commit to production) is the end-to-end latency of your delivery system; deploy frequency is closer to its throughput. They usually move together, but not always. A team can deploy daily while individual changes sit in review for a week. If you only watch one, watch cycle time; if you can watch both, the gap between them tells you where work queues up.
The four classic misuses
1. Setting it as a target. Goodhart's law is undefeated. Tell teams they're graded on deploys per week and you will get deploys per week: empty deploys, split deploys, config-only deploys at 4:55 PM on Friday. The metric is a thermometer. Mandating a higher reading doesn't cure the fever. If you want the number to move, remove the thing making deploys expensive and the frequency rises on its own.
2. Comparing teams against each other. Deploy frequency is shaped by architecture, domain, and risk profile. Your payments team in a SOC 2 environment with change-management controls will deploy less often than your marketing-site team, and that's correct. Compliance-heavy teams should be compared against their own trend line, not against teams with different constraints. The useful question is never "why is Team A slower than Team B?" It's "what changed for Team A since last quarter?"
3. Counting the wrong events. Merges to main, staging deploys, deploys that shipped zero changes because the pipeline runs on a cron. I've seen all three counted as production deploys. Each one inflates the number while the actual release process stays frozen. If your metric can improve without a single user-visible change shipping faster, your metric is measuring your tooling, not your delivery.
4. Reading the average instead of the distribution. One hyperactive service can carry an entire org's average. Percentiles or a simple histogram per service will tell you the truth in ten seconds: most orgs I've looked at have a bimodal distribution, a handful of services deploying on demand and a long tail deploying monthly. The long tail is where your improvement work lives.
The part nobody wants to hear: your deploy frequency is downstream of your test suite
Ask a team that deploys monthly why they don't deploy weekly, and you'll rarely hear "we don't want to." You'll hear some version of "we can't trust the pipeline." And in my experience the single biggest trust-killer is flaky tests.
The math is brutal. Say your CI run takes 30 minutes and 15% of runs fail on a flaky test unrelated to the change. Engineers learn that a red build probably isn't their fault, so they rerun. Now a deploy costs 30 to 90 minutes of wall-clock time plus the attention tax of babysitting it. Rational people respond by batching: wait for three or four changes, deploy them together, split the pain. Batching lowers deploy frequency, which raises batch size, which makes each deploy riskier, which makes people batch more. It's a flywheel spinning the wrong direction. In compliance-conscious shops it's worse, because every rerun of a gating check is a control you overrode on vibes, and your auditors will eventually ask about that.
This is why I tell engineering leaders: before you buy a metrics dashboard to track deploy frequency, spend a week finding out how many of your CI failures are flaky rather than real. If the answer is more than a few percent, that's your deploy frequency project. Quarantining the flaky tests so they stop blocking green builds, then fixing them in priority order, will move the DORA numbers further than any process change, because it attacks the reason people batch in the first place. Pipeline speed matters too (a 45-minute pipeline caps your realistic frequency no matter how much everyone trusts it), but speed without reliability just means you get untrustworthy answers faster.
We built BuildPulse around exactly this failure mode: detecting which tests are flaky from your existing CI output, quarantining them automatically, and giving you the numbers to prioritize fixes. Not because flaky tests are the only thing that suppresses deploy frequency, but because they're the most common one and the least visible from a metrics dashboard.
What to do with this on Monday
- Write down your definition of a production deploy. One sentence. Get your platform lead to agree with it.
- Instrument it from deployment events, not workflow runs or merges.
- Report the per-service median and the distribution, weekly. Never the org-wide sum.
- Pair it with change failure rate before you show it to anyone above you, so the incentive is never "deploy more, regardless."
- When a team's frequency is low, treat it as a question, not a grade. Ask what makes their deploys expensive. Then go look at their CI rerun rate before you blame their process.
Deploy frequency won't tell you whether your teams are productive. It will tell you, with uncomfortable precision, whether shipping a change at your company is routine or an act of courage. Measure it honestly and the number stops being a KPI and starts being a diagnosis.