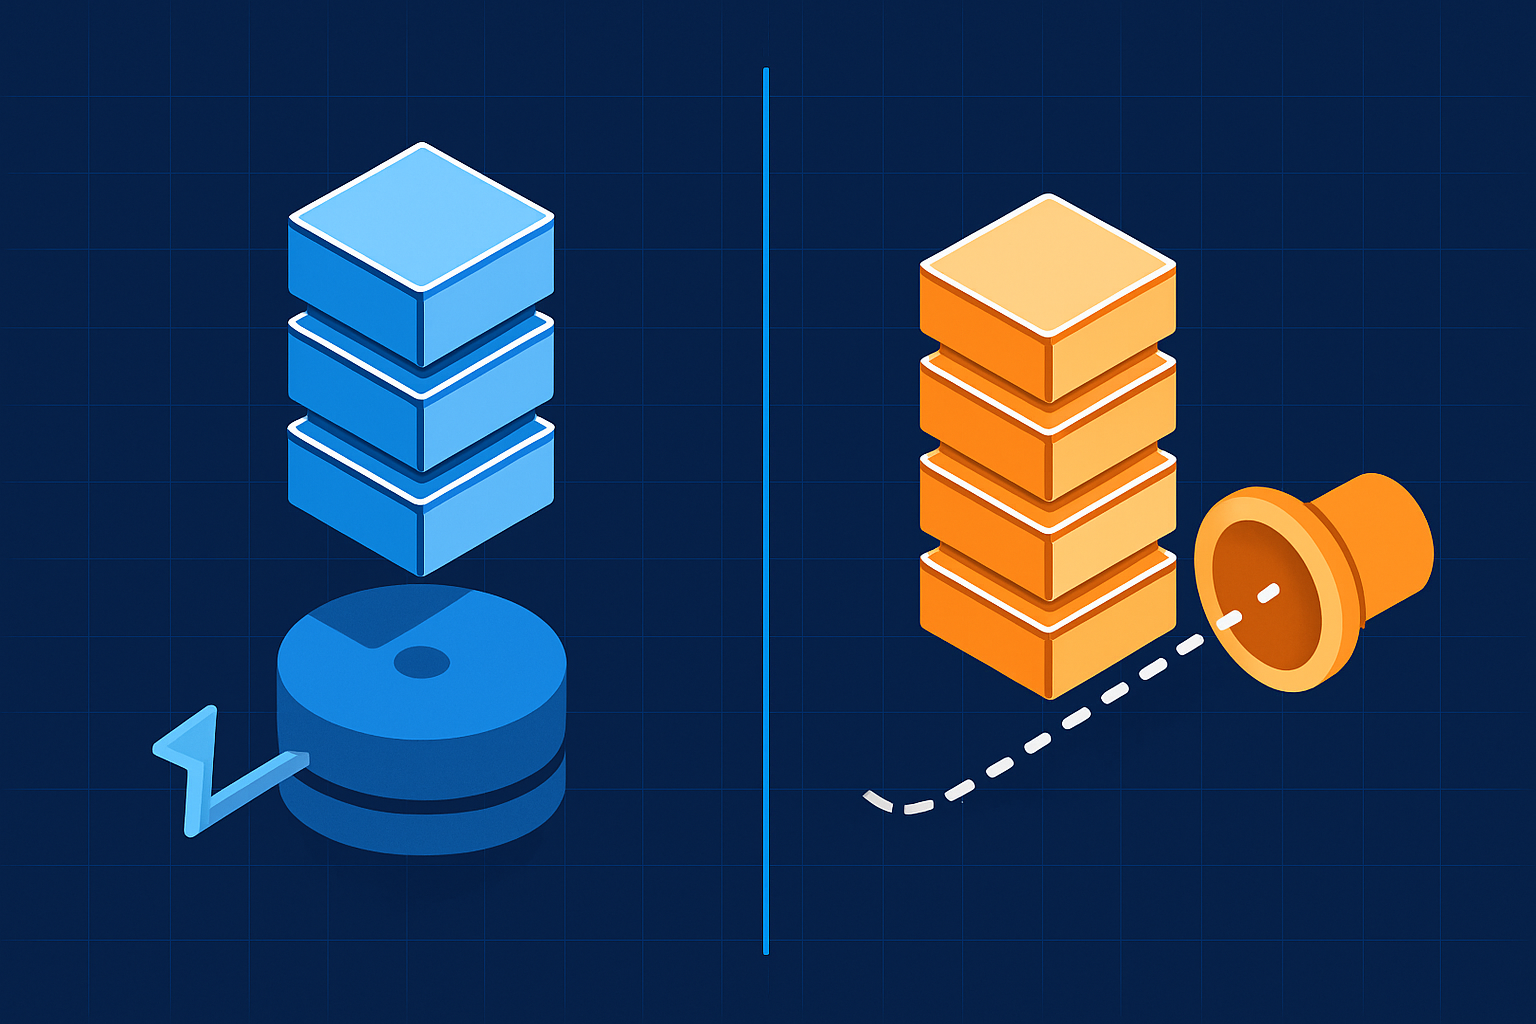
The cache that cost more than it saved
Last month I profiled a customer's Docker build job and found it spending 74 seconds downloading a layer cache from GitHub's cache API, then rebuilding almost every layer anyway because package-lock.json had changed. Then it spent another 96 seconds uploading the new cache. Total caching overhead: just under three minutes. Total time saved by the cache: about forty seconds.
That job ran roughly 120 times a day.
Docker image builds are usually the longest single job in a CI pipeline, and they're where GitHub-hosted runners hurt the most, because every hosted runner boots as a pristine VM with an empty Docker daemon. No layers, no BuildKit state, nothing. If you don't wire up caching deliberately, you rebuild the world on every push. And if you wire up the wrong caching, you can make things worse while feeling responsible about it.
So let's do this properly: one realistic app, four caching strategies, real numbers.
The benchmark setup
The app is a Node 20 API service in a mid-sized monorepo. Nothing exotic, which is the point:
- Multi-stage Dockerfile: deps stage (
npm ci, about 2m10s cold), build stage (tsc, about 70s), slim runtime stage - Final image: 410 MB. Total layer cache with intermediate stages: about 1.9 GB
- Build context after
.dockerignore: 180 MB - Runner:
ubuntu-latest(4 vCPU, 16 GB) unless noted
The Dockerfile follows the standard cache-friendly shape:
FROM node:20-slim AS deps
WORKDIR /app
COPY package.json package-lock.json ./
RUN npm ci

FROM deps AS build
COPY . .
RUN npm run build

FROM node:20-slim AS runtime
WORKDIR /app
COPY --from=deps /app/node_modules ./node_modules
COPY --from=build /app/dist ./dist
CMD ["node", "dist/server.js"]
I measured three scenarios per strategy: a cold build, a warm build where only application code changed (the common case), and a warm build where dependencies changed (the painful case). Each number is the median of five runs, wall-clock for the build step plus any cache import and export time, because that overhead is part of your build whether the dashboard itemizes it or not.
Baseline: no cache at all
Cold build:          8m 12s
Code-only change:    8m 12s
Dependency change:   8m 12s
Every build is a cold build. This is what you get by default on hosted runners, and I still see it constantly in the wild, usually because someone added caching once, it broke silently, and nobody noticed the Cache not found line scrolling past in green.
That's worth pausing on: a broken cache config doesn't fail your build. It just quietly makes every build cold. Grep your logs.
Option 1: the gha cache backend
This is the one everyone reaches for first because it's four lines of YAML:
- uses: docker/build-push-action@v6
  with:
    context: .
    push: true
    tags: ghcr.io/acme/api:${{ github.sha }}
    cache-from: type=gha
    cache-to: type=gha,mode=max
The results:
Cold build:          8m 58s   (export overhead on top of cold)
Code-only change:    3m 41s   (74s import, 52s export included)
Dependency change:   8m 47s   (import wasted, full rebuild, full export)
The code-only case is a genuine win over baseline. But look at the overhead: over two minutes of every warm build is spent moving cache blobs over GitHub's cache API, which in my measurements sustains roughly 50–90 MB/s. For a 1.9 GB layer cache, arithmetic is not on your side.
The sharper edges are structural:
- The 10 GB per-repo cache limit. Your Docker layer cache competes with your npm cache, your Gradle cache, and every branch's variants. A busy repo evicts entries in hours, so your "warm" builds are cold more often than you think.
- Branch scoping. A PR branch can read caches from its base branch and itself, nothing else. First push to every PR pays import for a cache that may only partially match.
- mode=max on every push exports all intermediate layers every time anything changes. That's the 52 second tax above, paid even when the build was fast.
The gha backend is fine for small images. For anything over a few hundred megabytes of layers, you're renting a slow disk over HTTP.
Option 2: registry cache
Same BuildKit feature, different transport: store the cache as an image in your registry.
- uses: docker/build-push-action@v6
  with:
    context: .
    push: true
    tags: ghcr.io/acme/api:${{ github.sha }}
    cache-from: type=registry,ref=ghcr.io/acme/api:buildcache
    cache-to: |
      type=registry,ref=ghcr.io/acme/api:buildcache,mode=max,image-manifest=true,compression=zstd
Cold build:          8m 44s
Code-only change:    3m 02s   (41s import, 48s export included)
Dependency change:   8m 21s
Meaningfully better than gha, for two reasons: registries pull layers in parallel and sustain higher throughput from Azure-hosted runners (I saw 120–180 MB/s to ghcr.io), and zstd compression shrinks both transfer and decompress time. You also escape the 10 GB limit and the branch-scoping rules entirely.
The costs move instead of vanishing: you're paying registry storage, your cache ref is shared mutable state (two concurrent main builds will race on the export, last write wins, usually harmlessly), and you should garbage-collect old cache tags or your registry bill becomes the new problem.
If you're staying on GitHub-hosted runners, this is the strategy I'd pick. It's the best you can do when your build machine has amnesia.
Option 3: a persistent runner with local BuildKit state
Now change the actual constraint. On a self-hosted runner (or a managed persistent runner) the Docker daemon and BuildKit state survive between jobs. There is no import step and no export step, because the cache never left:
- uses: docker/build-push-action@v6
  with:
    context: .
    push: true
    tags: ghcr.io/acme/api:${{ github.sha }}
No cache-from. No cache-to. The results, on a 4 vCPU persistent runner with NVMe:
Cold build (first ever):   7m 58s
Code-only change:          48s
Dependency change:         4m 05s
The code-only case drops from three minutes to under one, and the dependency-change case improves too, because base image layers and the unchanged stages are already local. This isn't clever engineering. It's the absence of a workaround. Layer caching is how Docker was designed to work on a machine that remembers things.
The honest caveats:
- Disk pressure is now your job. Set a prune policy or NVMe fills up in weeks:
docker buildx prune --keep-storage 40GBon a schedule works fine. - Cache locality. With a pool of runners, a job only hits the cache on a machine that built that image before. Small pools are naturally sticky; large pools need affinity or you regress toward cold builds with extra steps.
- You own the fleet. Patching, scaling, and the 3 a.m. page when a runner wedges. This is the real cost of DIY self-hosted runners, and it's why teams either staff it properly or use a managed pool. BuildPulse runners are the managed version of exactly this setup: persistent NVMe-backed machines with warm Docker layer caches and cache-aware scheduling, at about half the per-minute cost of GitHub-hosted.
Side by side
Strategy               Cold      Code change   Dep change
No cache               8m 12s    8m 12s        8m 12s
gha cache backend      8m 58s    3m 41s        8m 47s
Registry cache         8m 44s    3m 02s        8m 21s
Persistent local       7m 58s    48s           4m 05s
Multiply the code-change column by your daily build count. At 100 builds a day, registry cache versus persistent local is about 3.7 engineer-hours of waiting per day, or roughly 900 hours a year, for one service. That's before you count the compute bill, and before you count the behavioral effects: when builds take eight minutes, people batch commits, skip CI locally, and stack PRs, and your feedback loop degrades in ways that don't show up on any dashboard.
Sharp edges that show up in every strategy
A few things bit me during benchmarking that will bite you in production:
- Dockerfile ordering still dominates. If you
COPY . .beforenpm ci, no caching strategy on earth saves you. Copy lockfiles first, install, then copy source. Boring advice because it's load-bearing. .dockerignoreis a performance file. My build context dropped from 700 MB to 180 MB by excluding.git, test fixtures, and local artifacts. Context upload happens before any cache logic runs.mode=minversusmode=max.minonly exports final-stage layers, so multi-stage builds get almost no cache benefit from it. If you use remote cache, usemaxand accept the export cost, or you're doing ceremony without the benefit.- Timeout-driven flakiness. Slow builds push jobs toward their timeouts, and jobs near timeouts fail nondeterministically under runner load. If you have "flaky" jobs that only fail during peak hours, measure their duration distribution before blaming the tests. We wrote about separating real test flakiness from infrastructure noise in our guide to flaky tests, and the distinction matters doubly in compliance environments where every red-then-green rerun on a protected branch is something you may have to explain later.
What I'd actually do
My decision tree, having run all four in anger:
- Small images, low build volume: gha cache backend. It's four lines and good enough under about 500 MB of layers.
- Real images, hosted runners: registry cache with zstd and
mode=max, plus a scheduled job to prune old cache tags. Best available option when every runner starts empty. - More than 30–50 Docker builds a day, or images over 1 GB: persistent runners, managed or self-hosted. The physics of moving gigabytes over a cache API loses to a local NVMe every single time, and no amount of YAML changes that.
The uncomfortable truth about GitHub Actions build optimization is that most of it is compensating for ephemeral machines. Remote caches, cache warming jobs, cache-restore actions: all of it is shipping state to a computer that threw its state away on purpose. Sometimes that tradeoff is right. Ephemeral runners are simple and clean-room secure. But if your team ships containers all day, at some point the honest move is to stop optimizing the workaround and give your builds a machine with a memory.
Run the benchmark on your own longest Docker build. Median of five, all three scenarios, overhead included. The spreadsheet takes an afternoon and usually pays for itself by Friday.